In this chapter you will learn how to use MIMCal. This software module is the basic tool to run the machine capability study MFU
Chapter contents:
1.
Settings for the machine capability study MFU
2.
Evaluation of results
3.
Display of results for distinct needles
4.
Time trend for X/Y/A deviations
Settings for the machine capability study MFU:
top
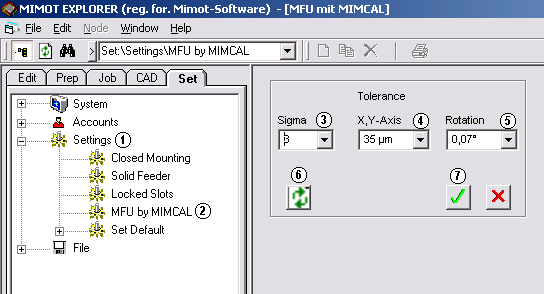
1 - Select "Set" - "Settings (1)" and finally "MFU by MIMCal (2)".
3 - Select a value for sigma to define the tolerance range: 3 sigma = narrowest range, 6 sigma = broadest range of tolerance.
4 - Tolerance value for X and Y axis
5 - Tolerance value for angle A (in degrees)
6 - Refresh display of tolerance settings
7 - Confirm and save new settings
Run MFU measurements:
Select
 to start cyclic placement of the glass component. This is the core process of the MFU study. Results are written to "MIMOT_1/SYSMAP/MFUKON1.TXT".
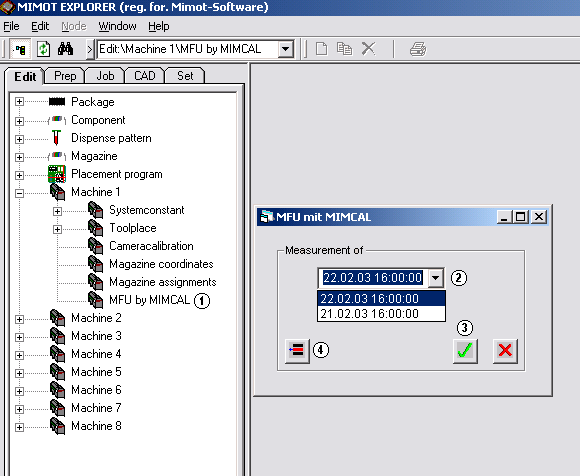
1 - Select "MFU by MIMCal (1)" from Edit
2 - The selection window provides a list of measurements - sorted by date and time
3 - Confirm selection
4 - Delete measurement results
The following analysis pane shows up:
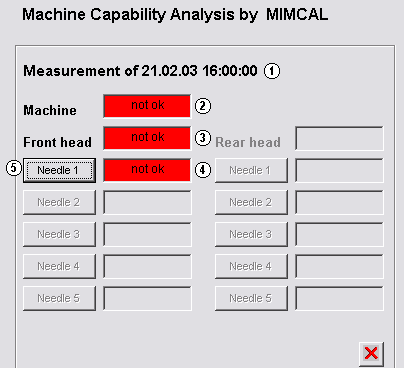
1 - Date and time of measurement
2 - Machine status
3 - Head status
4 - Needle status
5 - Select detailed status for needle n
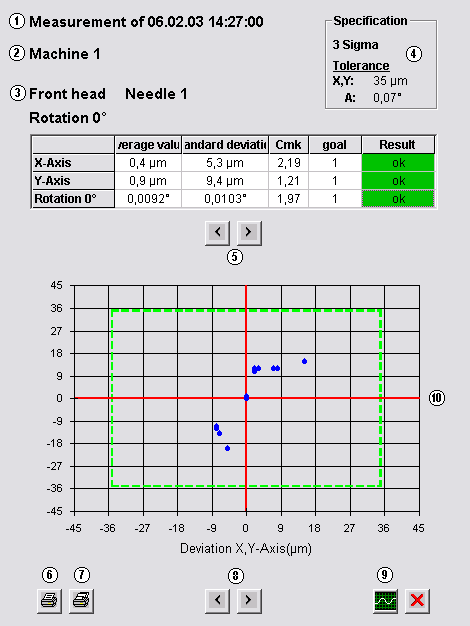
The following pane opens:
1 - Date and time of measurement
2 - Number of machine
3 - Indication of head/needle/angle for the resulting measurement values
4 - Tolerances which have been defined in "SET"
5 - Show previous/next angle
6 - Print
7 - Printer settings
8 - Show previous/next needle
9 - Display a timeline of results for needle measurements
10 - Diagram of deviations in X and Y directions
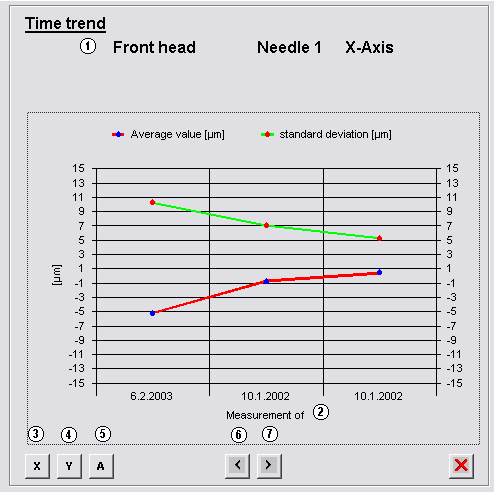
Clicking (9) you will get the following time trend display:
1 - Name of the measured axis
2 - Date line of measurements
3 - Select deviation values of the X axis
4 - Select deviation values of the Y axis
5 - Select deviation values of the A axis
6 - Go to previous needle
7 - Go to next needle
MIMOT specialists would be glad to assist you in interpreting critical data to find the root cause of machine malfunctioning.